Insurers face unprecedented challenges arising from a decade of near-zero yields followed by a global pandemic and consequent supply-driven inflation shock, and an ever more competitive marketplace . In addition to hard choices regarding allocation of capital, the asset side of the balance sheet has become a critical source of value. Insurers with traditionally cautious investment portfolios have looked to a range of emerging investment opportunities, pushing lower in the credit spectrum and capturing liquidity spread through exposure to private market assets.
Regulators have evolved risk-based capital rules, reacting to this changing landscape. Fundamental changes have also been made to the accounting regime insurers use to report the financial position of their business. In turn, insurers commit increasing specialist resource in order to comply, report and optimize their business with respect to the ever-changing regulatory and accounting regimes in which they operate.
Quantifying the risk associated with alternative investments, and understanding how these help an insurer achieve objectives within the limits of their risk profile is a complex problem. Objective data and analytics to validate investment decisions can be scarce. In this article, we aim to provide a different perspective by showing how economic scenario models and analytics can be used to assess the impact of a wide range of alternative investment asset classes on an insurers’ risk and return profile.
Assessing investment risk and optimizing investment strategies for insurance
An insurer’s assessment of strategic investment options involves distinct stakeholders with sometimes conflicting objectives and constraints. For asset managers and investment advisors, this creates a number of challenges such as:
- How to engage with insurance clients in a way that demonstrates the value of a manager’s investment offering in the context of an insurer’s financial objectives and risk profile?
- What contribution can alternative assets such as private market or structured credit make to delivering those objectives?
- How can risk models and analytics be applied to meet these challenges and deliver better investment outcomes within the client’s risk budget? Do these models capture alternative assets, where data and access to specialist expertise may be limited?
Let’s explore how investment managers can utilize models and analytics that are already widely used by insurers themselves to present investment solutions in terms that resonate with their insurance clients.
Case Study
While features of our example insurance business are amplified for illustrative purposes, these highlight risk management challenges for typical long-duration liability insurance or pension transfer business. This will allow us to demonstrate the sort of metrics and analytics that an insurer may typically use to consider a diverse range of strategic investment options.
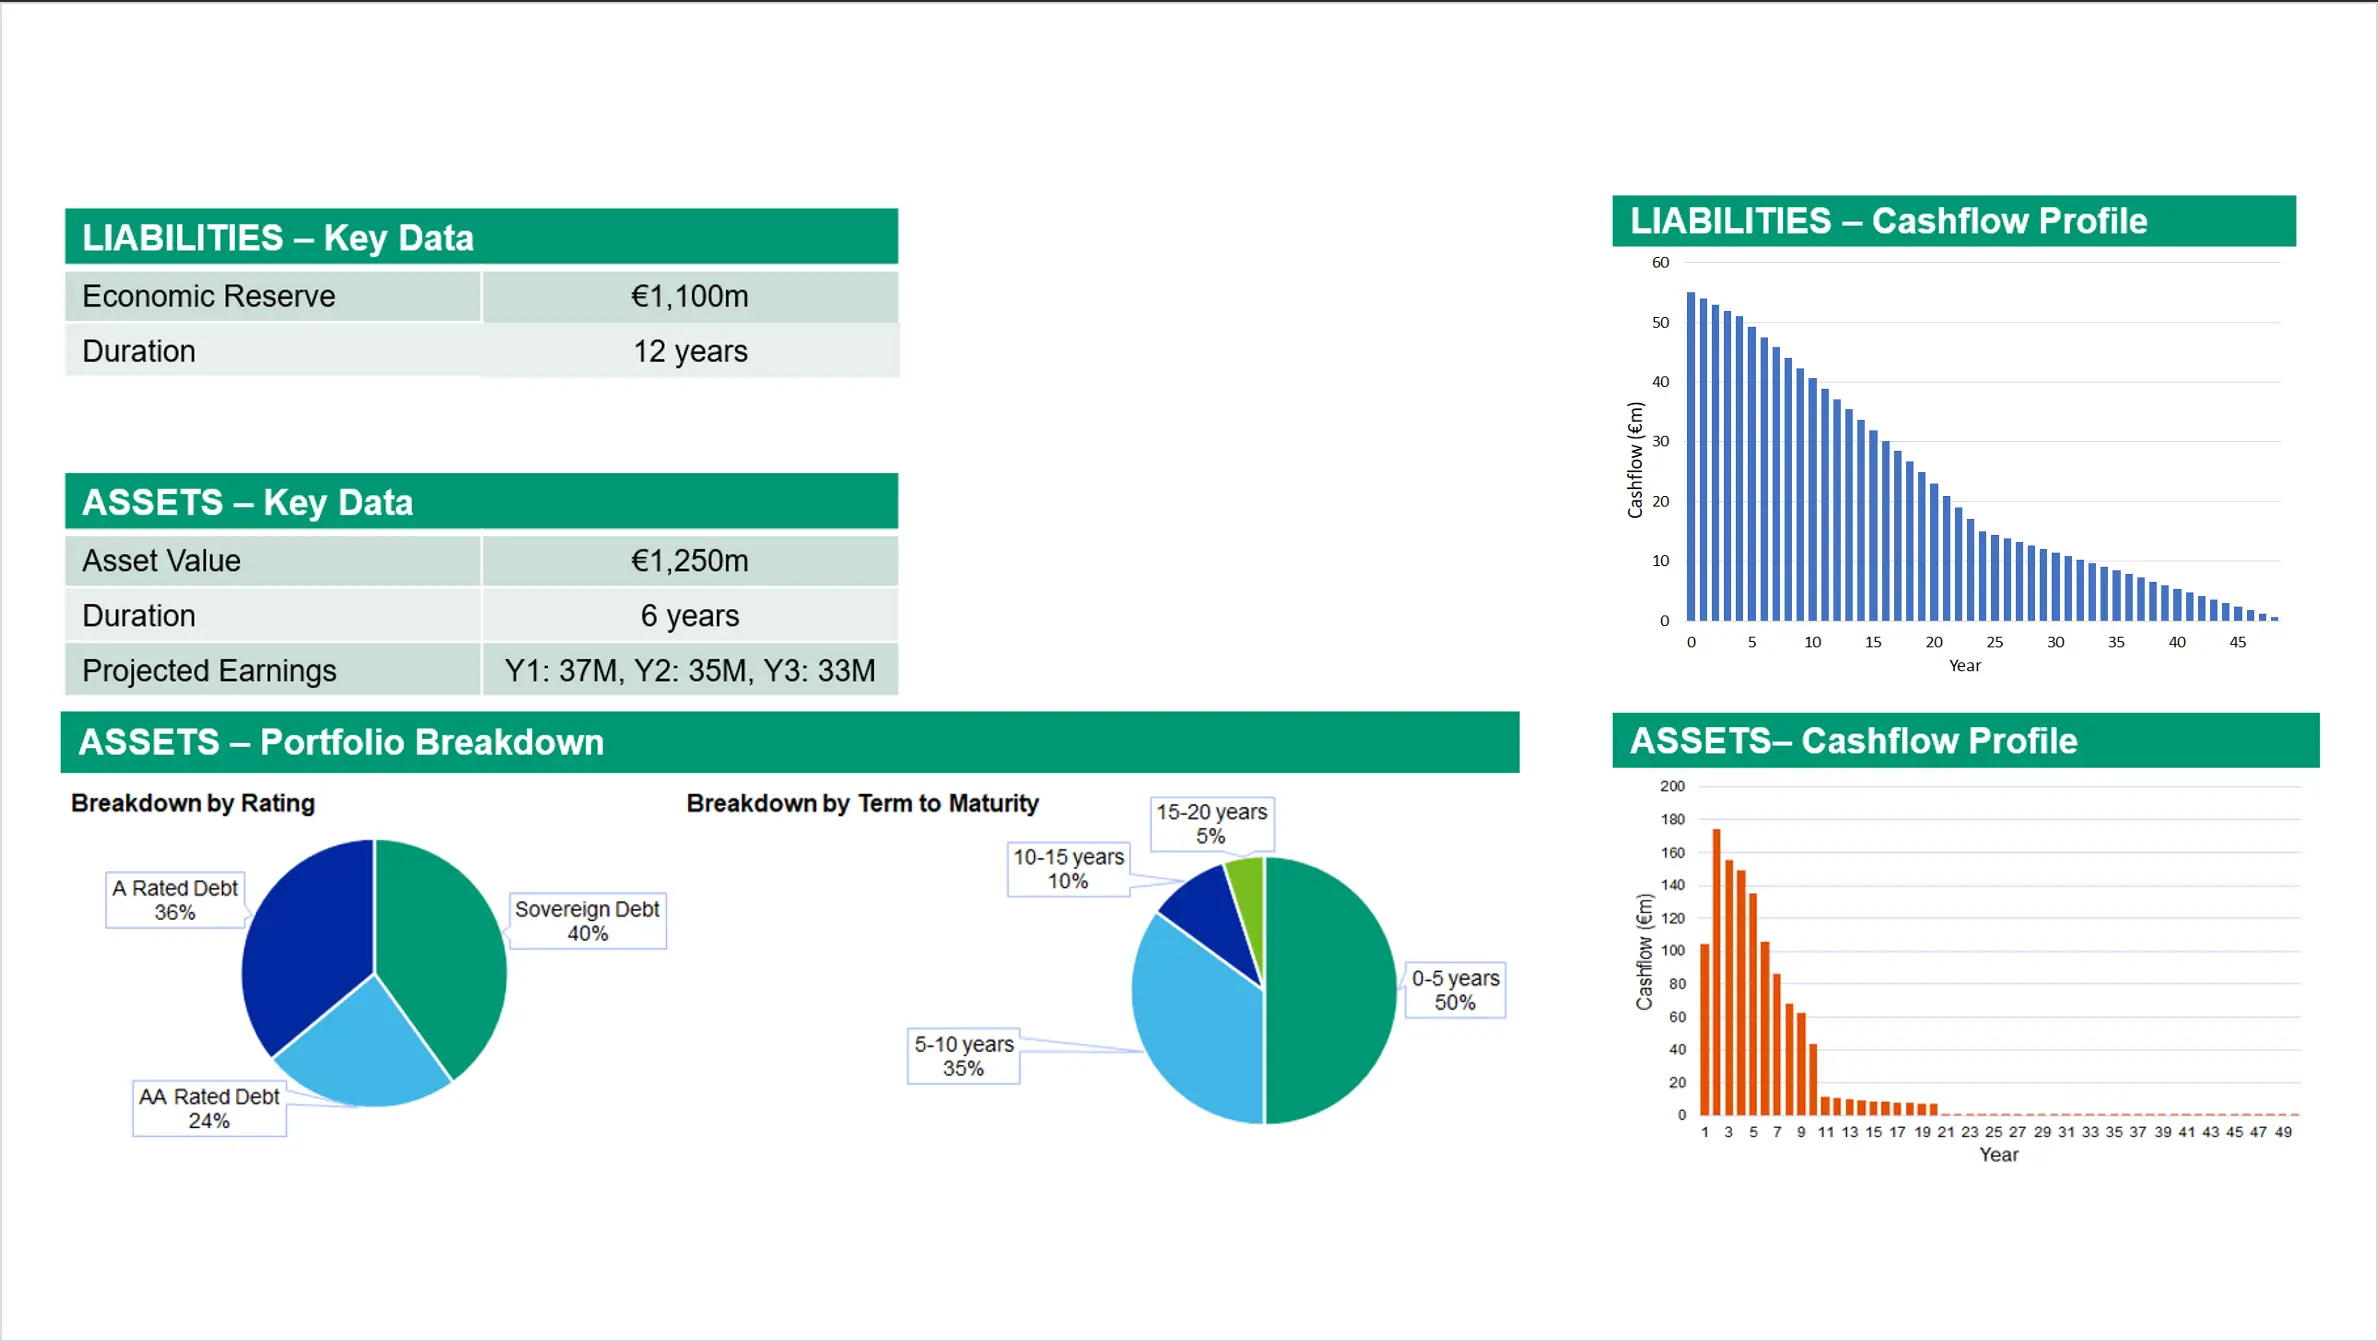
Figure 1a shows that our example European insurer has liabilities with a market value of EUR 1.25 Bn, with weighted duration of ca. 12 years. A traditionally cautious asset portfolio comprising government and high quality investment grade corporate bonds has a significantly shorter duration.
Impact of “Liability-Aware” Investments
A start point might be to consider better “liability-matching” investments. In this example, “liability-aware” might be a better term; we simply adjust bond allocations across the maturity spectrum to target the Duration and Cashflow profile of the liabilities.
In Figure 2 below, the current or “Base” portfolio is represented by the PURPLE dot, while the Cashflow Matched strategies are represented by the series of BLUE dots, varying from 100% Government Bonds to 100% Investment Grade Corporate (a mix of AA and A rated).
The left hand panel illustrates risk (x-axis) and return (y-axis) in terms of asset returns (% pa). As we would expect, asset risk increases for the longer duration cashflow-matching strategies.
In contrast, the right hand panel shows risk-return in terms of projected economic surplus (EUR) for this insurer. On this basis, these simple cashflow matching strategies show much lower risk, and higher risk-adjusted return. Based on the 3-year term shown in Fig. 2, cashflow matching strategies can generate an extra 60-70 bps of annual return, or ca. EUR +20M increase in surplus at a risk level comparable with the current strategy.
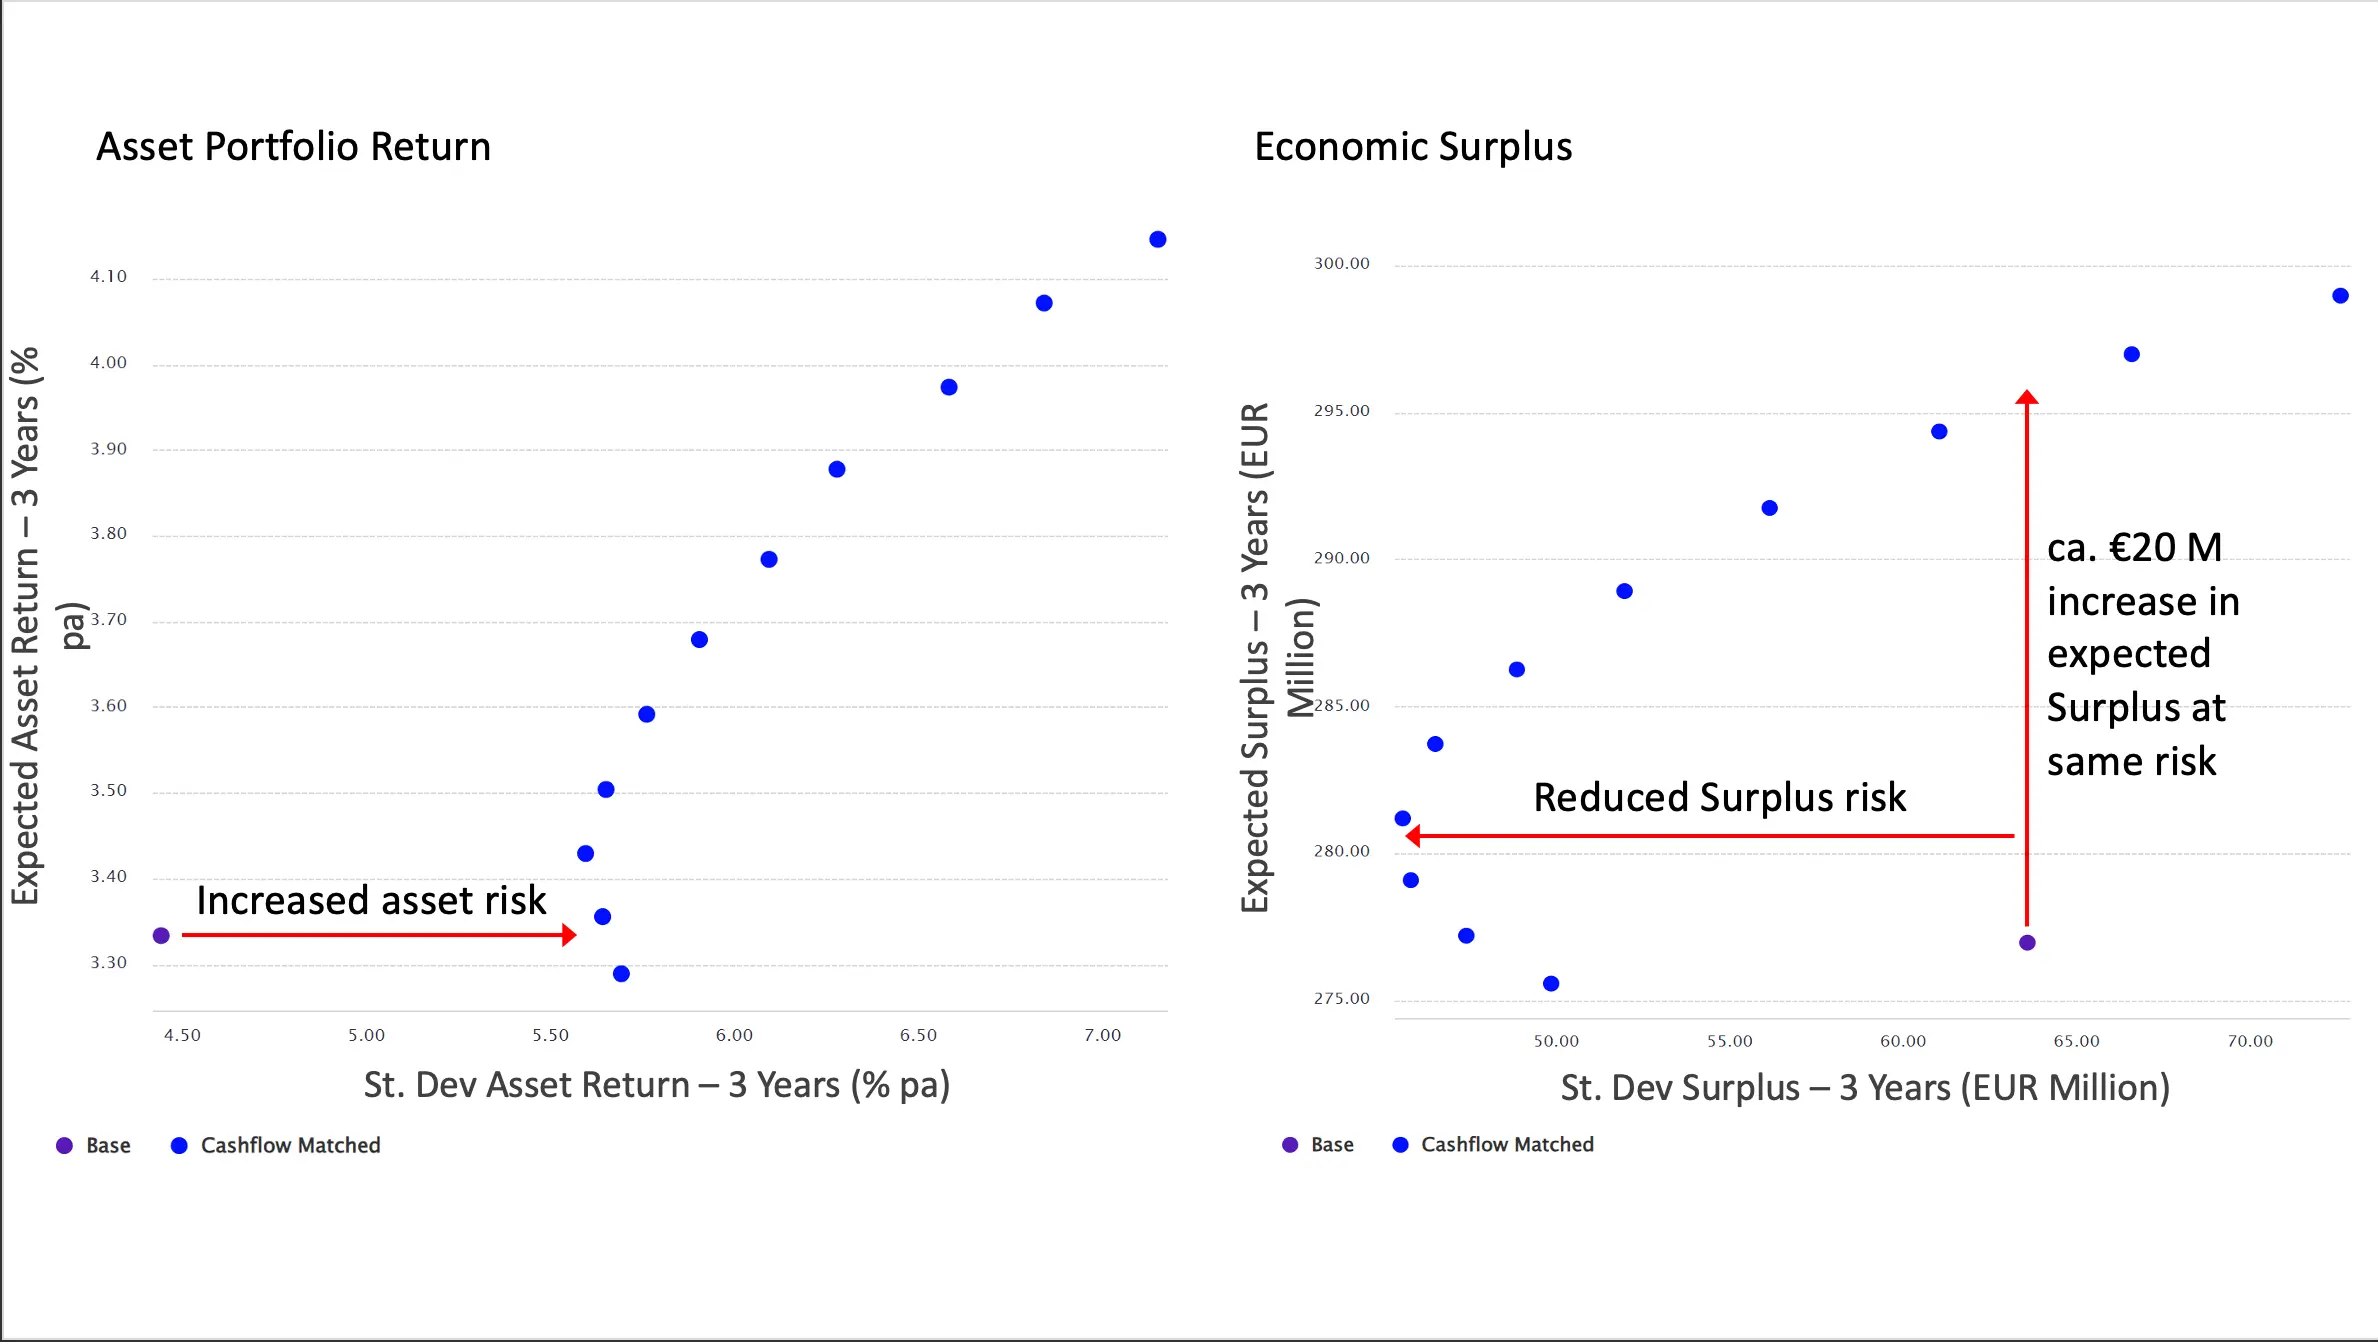
Source: Moody’s Analytics PFaroe Insurance solution
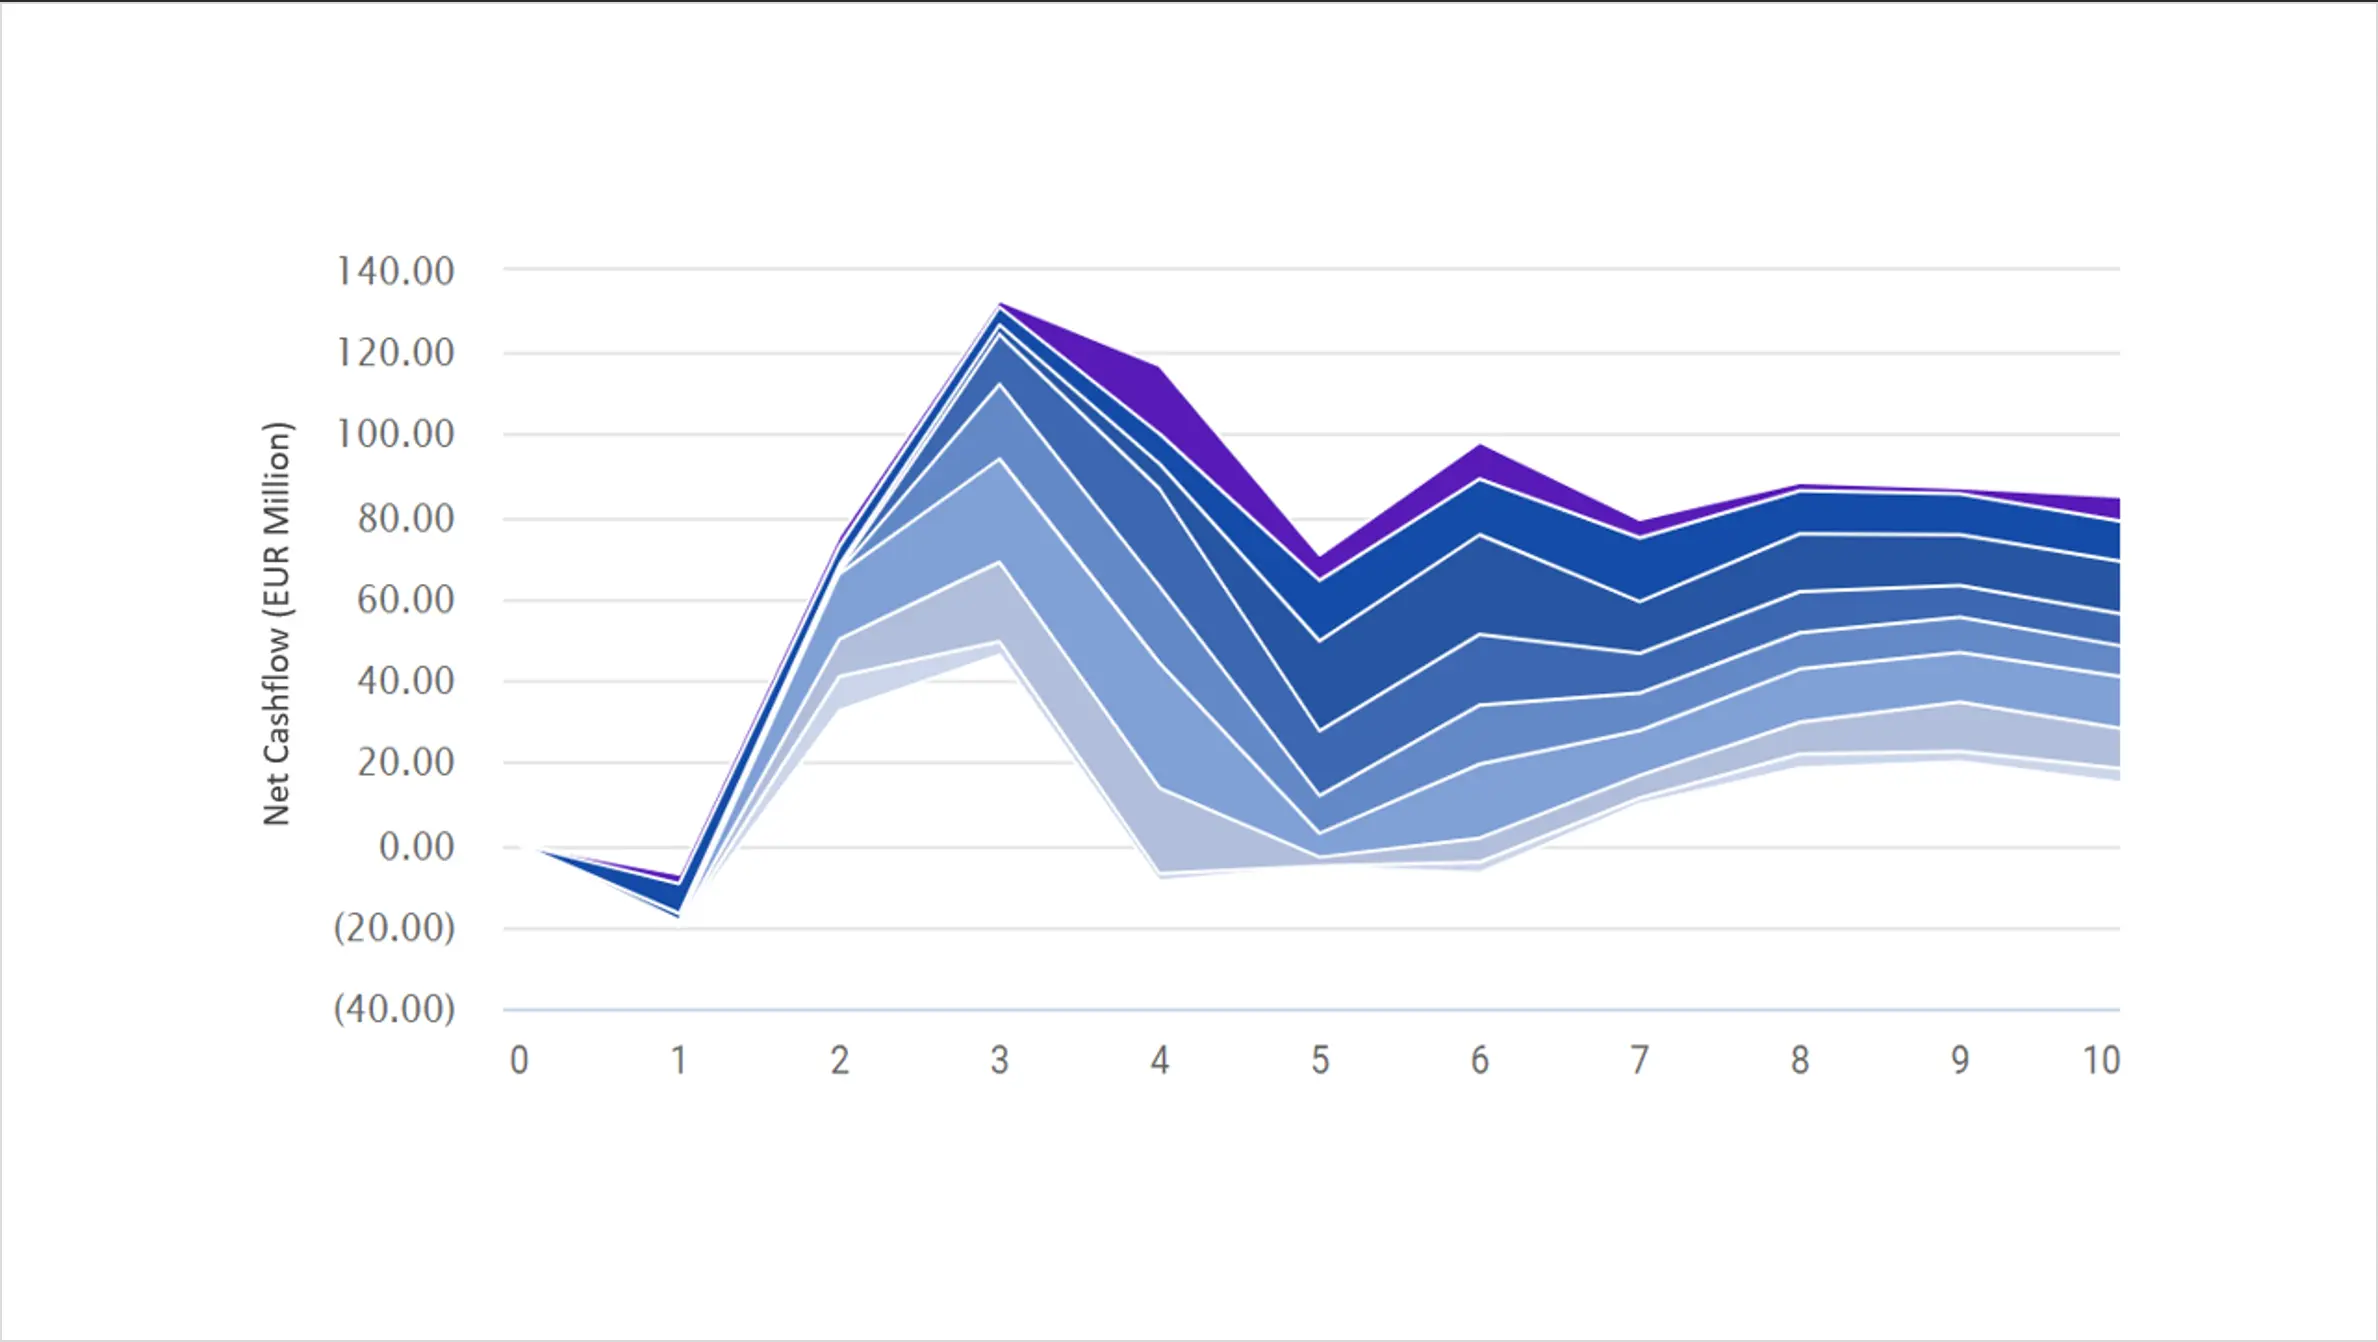
Taking this a step further, we can quantify the impact on the projected Net Cashflows. In Figure 3, the right hand panel confirms the cashflow-matched strategy produces a very much narrower range of projected Net Cashflows. Other than in year 1, where there is insufficient cashflow today (based on the current portfolio) to meet all the liabilities, switching to the Cashflow Matched strategy generates a positive Net Cashflow, with a high degree of certainty.
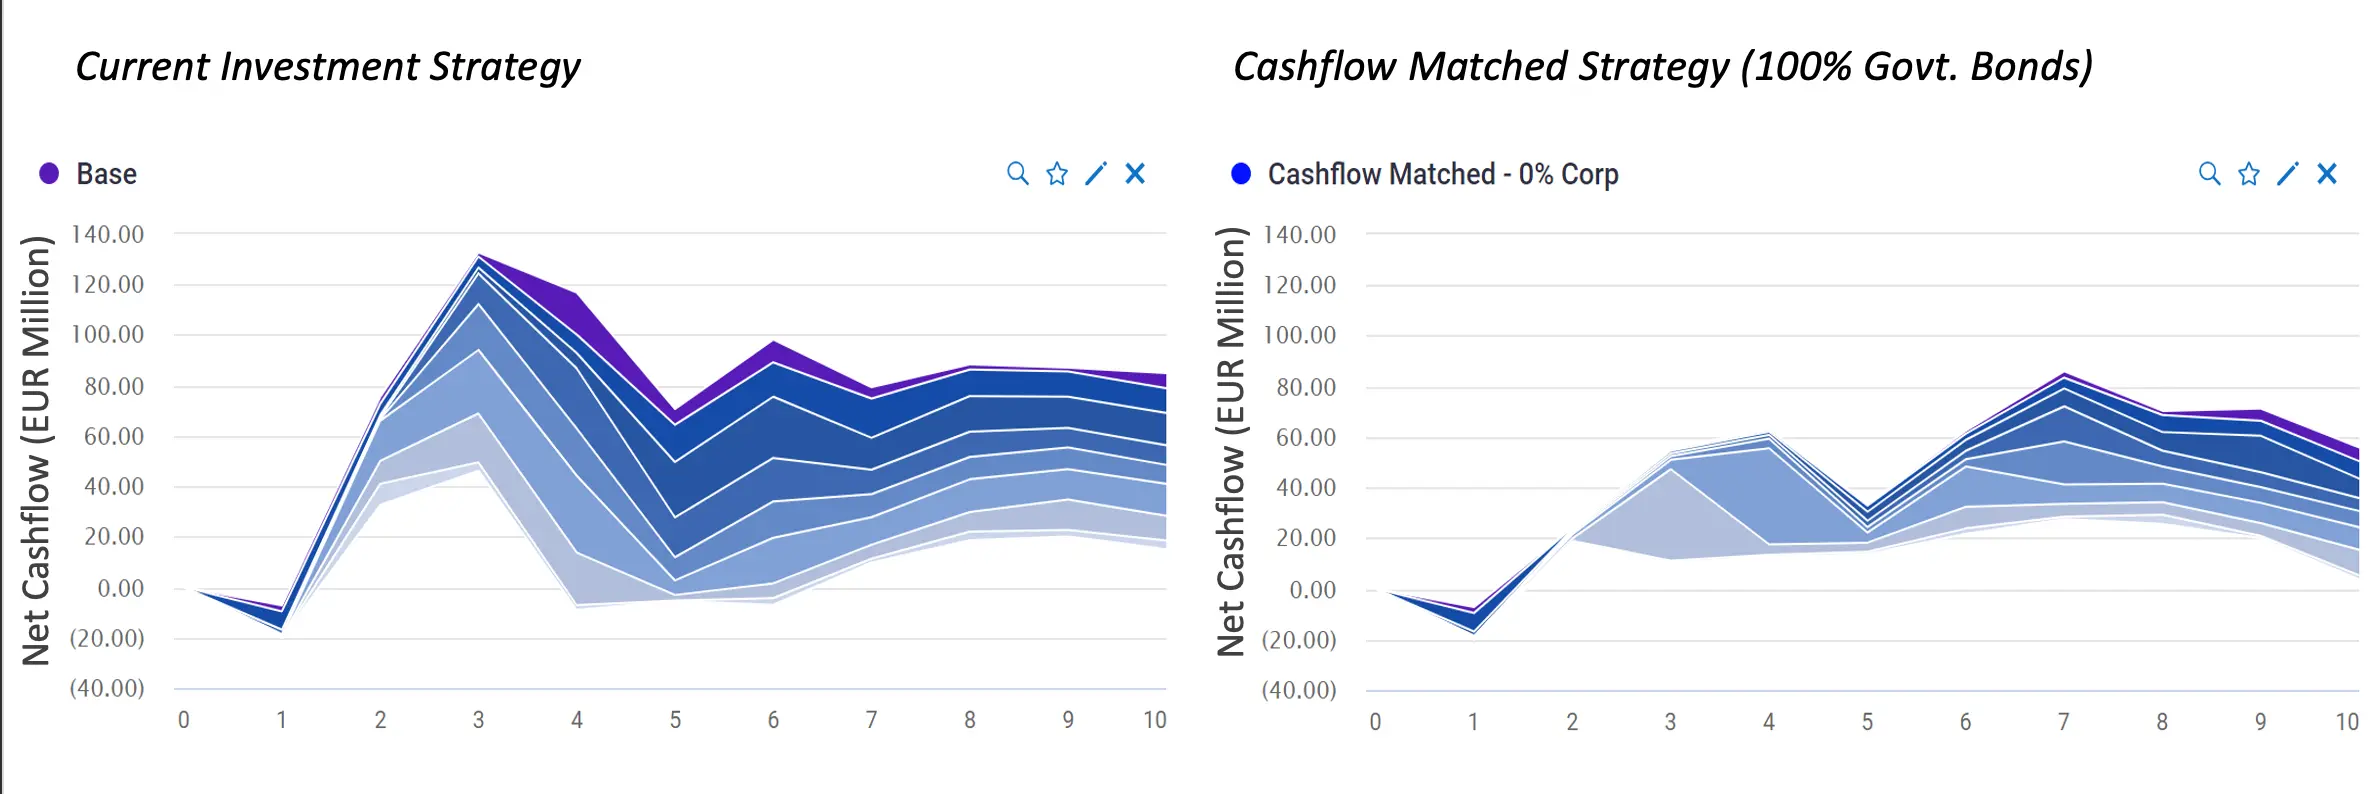
Source: Moody’s Analytics PFaroe Insurance solution
Alternative assets: assessing the impact for insurers
The same economic models have been calibrated to a wide range of alternative asset classes. Moody’s Analytics has access to extensive proprietary data and models for credit risk, and this combined with a range of third party market data sources allows us to represent the full range of alternative, private market and structured assets, typically used by insurers. We have included a limited subset in this case study, shown in Figure 4.
In this analysis, we stress the current “Base” investment strategy, to include varying allocations to a number of alternative asset classes: real estate debt, private credit, EM debt, structured credit (a mix of MBS and ABS), infrastructure and private equity. These different asset classes are represented by the different series of colored dots in Figure 4.
In terms of the projected surplus, exposure to any of these different asset classes will increase risk and return. However, the impact varies significantly across these different asset classes.
Figure 4 shows that under the current set of assumptions and asset definitions used here, real estate debt, private and structured credit seem to provide a more attractive risk-return trade-off than private equity, or particularly EM debt.

Optimization: Combining Cashflow Matching with Alternative Asset Classes
An intuitive next step in identifying optimal investment strategies for our insurer would be to combine the cashflow-matched strategies with these higher yielding alternative assets.
In Figure 5, the dark blue dots represent the cashflow-matched strategies. The light blue dots represent combinations of the lowest risk cashflow-matched strategy, together with varying allocations to Real Estate Debt, up to a maximum of 30%.
While adding Real Estate Debt to the matched strategies increases asset portfolio return by ca. 0.6% pa (left panel), the incremental impact on projected surplus, over that achieved through credit exposure alone, appears relatively limited. It is worth noting that this analysis represents Moody’s default assumptions at a particular point in time. These results and conclusions could be impacted if an asset manager’s was to impose their own views regarding credit and liquidity spreads.

Source: Moody’s Analytics PFaroe Insurance solution
Focusing on insurance-specific financial objectives and risk metrics
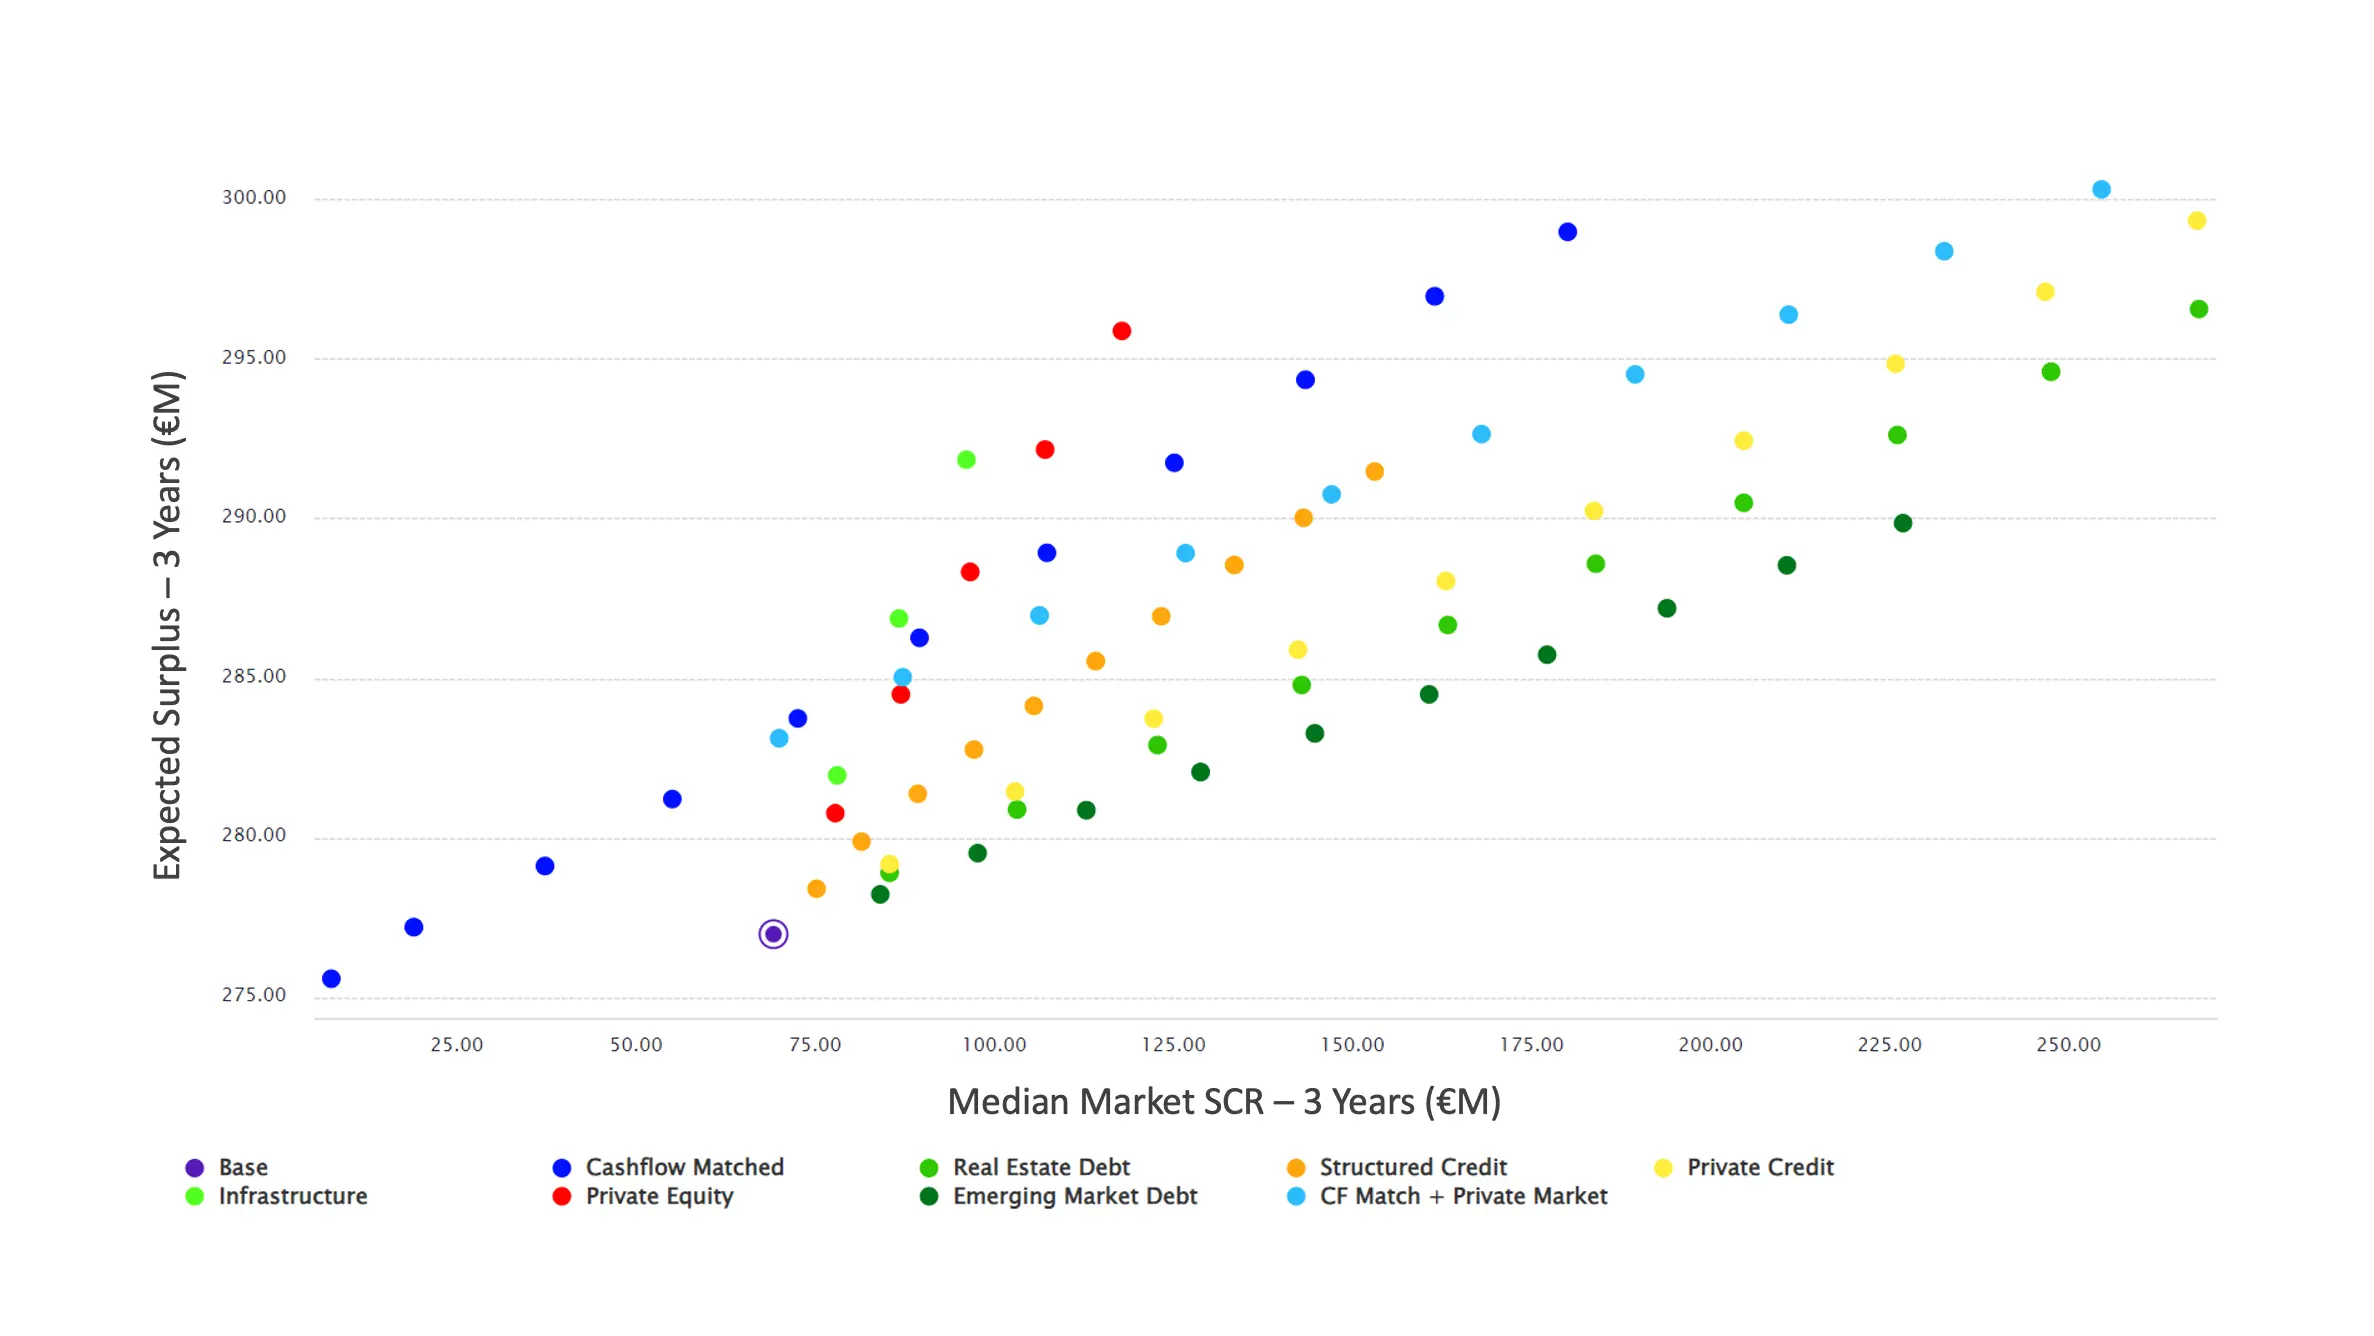
Finally, the same models can be used to compare these investment strategies using metrics that are most relevant to specific insurance stakeholders. This could include specific accounting items or capital metrics. As an illustration, Figure 6 shows the impact of these different strategies in terms ofour insurer’s Solvency 2 capital requirement (SCR).
This analysis allows the investment partner to focus on optimizing strategies that fit within the client’s capital constraints.
In this example, the analysis shows that those strategies with exposure to alternative assets are likely to increase required capital. However, we can identify investment options that can maximize asset yield or shareholder value, subject to defined capital constraints. By combining cashflow matching with alternative assets, insurers may be able to achieve significant increases in yield or surplus within defined capital limits, or with limited impact on current capital requirement.
Source: Moody’s Analytics PFaroe Insurance solution
Conclusion – Analytics can help translate investment value into insurance outcomes
In this article, we used a relatively simple illustrative example using Moody’s Analytics PFaroe Insurance solution to demonstrate how economic scenario models and analytics can be used to frame multi-asset investment solutions in terms that reflect an insurer’s objectives and risk profile.
The analysis shown can be extended to assess the impact across a range of alternative assets. These assets often have complex risk and cashflow structures, and data to calibrate models to these assets may be limited. Moody’s Analytics unique access to research and data covering a wide range of credit types, combined with our economic scenario and asset-liability modeling capabilities, offers a unique solution for asset managers and investment advisors seeking to enhance their offering in the insurance market.
For further information please visit: https://pfaroe.moodysanalytics.com/