Introduction
Global markets in 2022 were tumultuous with inflation levels reaching peaks not seen for decades. With monetary policy driving rises in interest rates to curb inflation, the past 18 months have seen dramatic increases in interest rates in the United States.
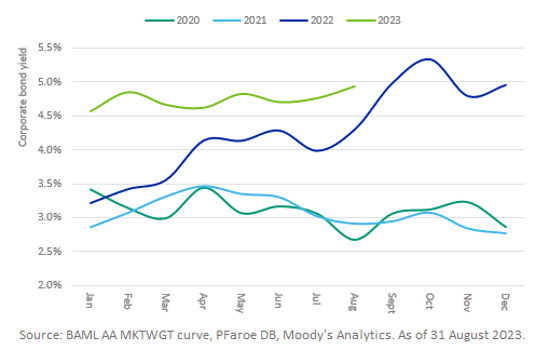
With credit spreads staying broadly level over the past 18 months, a corresponding increase in corporate bond yields (as shown in the following chart) has also occurred. As corporate bond yields drive accounting-based pension plan liabilities, this increase in yields has been a good news story for traditional final salary pension plans. Based on the sample of traditional plans modelled on PFaroe DB, we’ve observed a decrease in liabilities ranging between 20-30% within the same timeframe. Asset returns for the same sample of plans ranged from -10 to -20% over the same period leading to an increase in funding level of typically around 10%.
Corporate Bond Yields
For sponsors of cash balance plans the impact on plan liabilities and funding levels over the same period is less clear due to the nature of a key assumption in the valuation of a cash balance plan’s liability – the interest crediting rate. There are effectively two opposing forces that drive interest rate sensitivity and the valuation of the liabilities – the cashflow discount rate and the interest crediting rate (ICR).
In a 2018 survey[1], 35% of cash balance plans had an ICR based on long-term yields, such as 30-year Treasury bonds. For such plans, the significant increase in Treasury yields over the past 18 months will have typically resulted in a small overall change in liabilities as the two forces cancel each other out.
A further 30% of cash balance plans referenced Treasury yields with a minimum floor. The interplay between the floor and the variable Treasury yield makes this type of interest credit rate the most complex to model. In this article, we look closely at this type of plan as rising interest rates may lead to significant mismatches between liability and asset duration occurring quickly which in turn can lead to detrimental results of the LDI hedging strategy in place.
What is a cash balance plan?
Before diving into the detailed analysis, let’s begin by defining a cash balance plan. Sometimes referred to as a ‘hybrid’ plan, a cash balance plan is a defined benefit plan that functions similarly to a defined contribution plan. It defines its basic benefit not as an annuity payable at retirement, but instead as a lump sum account. Each year, a participant’s account is credited with a “pay credit” (a percentage of the employee’s overall compensation from their employer) and an “interest credit” (interest on the account balance) where the interest rate used can be either a fixed rate or a variable rate, prevailing at that time.
The underlying rate used to drive the ICR varies greatly with the most commonly used rate being a benchmark Treasury yield. In this case, increases and decreases in the value of the plan’s investments do not directly affect the benefit amounts promised to participants and the investment risks are borne solely by the employer.
There are also cash balance plans with “market based” interest credit rates, such as a blend of S&P 500 and Bloomberg Aggregate total returns. In this case, the investment risks are transferred more to the participants and this type of plan is closer to exactly mimicking a defined contribution plan. Market-based cash balance plans are not discussed further in this article.
The type of plan we discuss in this article use an ICR that references a benchmark Treasury yield with a minimum annual increase.
Interest rate sensitivity of cash balance plan
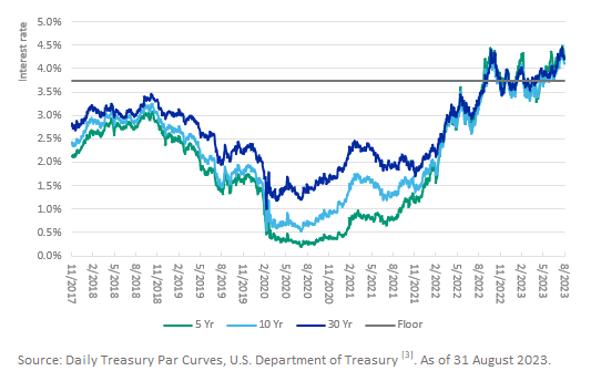
Where the ICR is defined as a long Treasury yield with a minimum floor, the historically low Treasury yields of the last few years have seen the floor consistently being applied. However, as shown in the following chart, over the last 18 months, Treasury yields have risen rapidly and yields are now running at levels higher than a plan’s minimum rate (for example, 3.75%). This rise in Treasury yields significantly changes the dynamics of such a plan’s interest rate sensitivity and consequently the appropriate asset allocation if an LDI approach is taken.
Treasury Yields
In recent years LDI driven strategic asset allocations for such cash balance plans have typically been set assuming the floor continues to apply. But should this approach continue to be followed in the future? We consider different approaches to modelling the ICR and discuss how these approaches have a major impact on both the construction of an LDI portfolio and the resulting funded position of the plan.
Case Study
Let’s consider a sample cash balance plan roughly split 65%/15%/20% active, terminated vested and retiree liabilities, respectively. All non-retiree liabilities follow a cash balance plan design and the retiree liability is a simple stream of fixed annuity payments (representing participants who have elected to convert their account balance on retirement to a stream of level annuity payments).
The plan’s ICR is defined as the 30-year Treasury yield with a minimum floor of 3.75%. This ICR definition effectively means that the plan has written a set of complicated interest rate call options on 30-year forward Treasury yields and therefore there are two key elements to consider when setting the ICR assumption for such a plan:
- Estimated future 30-year Treasury yields
- The 3.75% year-on-year floor
For 1), a common approach taken in practice is to use the current 30-year Treasury yield and assume it remains level across all future years. This assumption has a significant impact on the valuation of the plan’s liabilities as some benefits are paid out a long time into the future (consider a current 25-year old retiring at 65, i.e. there is 40-year timeframe until the benefit is paid). Alternative approaches that would better take account of the benefit being paid far into the future include either:
- using implied forward rates from the current Treasury yield curve to determine expected 30-year Treasury yields at each future year.
- using a stochastic model to simulate 30-year Treasury yields over a 50-year time horizon
For 2), the simplest approach would be to model the ICR as the maximum of the 30-year Treasury yield and 3.75%, but this approach ignores the underlying optionality that exists within the ICR definition. Alternatively, an option pricing model such as Black’s model, a derivatives pricing model used for valuing assets such as options on futures and capped variable rate debt securities, could be utilized. While still not fully ‘technically correct’, using such a model is an effective way of incorporating the optionality present in a fairly straightforward way.
The following chart shows the daily ICR assumption under two of these approaches:
- Current 30-year Treasury yield assumed flat going forward with a “simple” floor of 3.75% applied (Dark blue)
- Current 30-year Treasury yield assumed flat going forward with Black’s model applied using a floor of 3.75% and volatility of 1% (Light blue)
Daily ICR Assumption Analysis
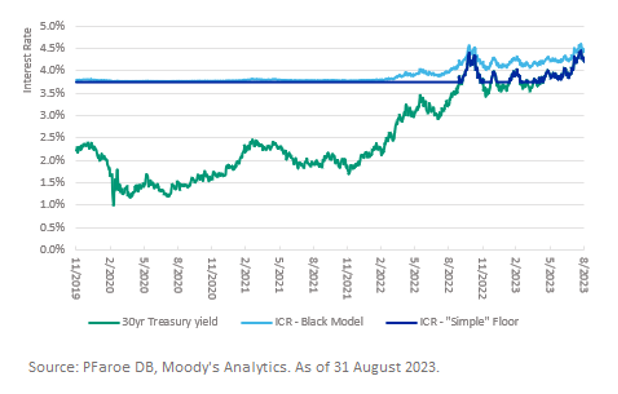
The light blue line most accurately captures both the variable nature of the ICR and the underlying floor. But what does this mean for how the plan’s asset portfolio is performing? For a plan following an LDI strategy, the liability interest rate effective duration is the primary measure used in constructing an appropriate matching portfolio. This measure is fundamentally affected by the approach taken to model the ICR.
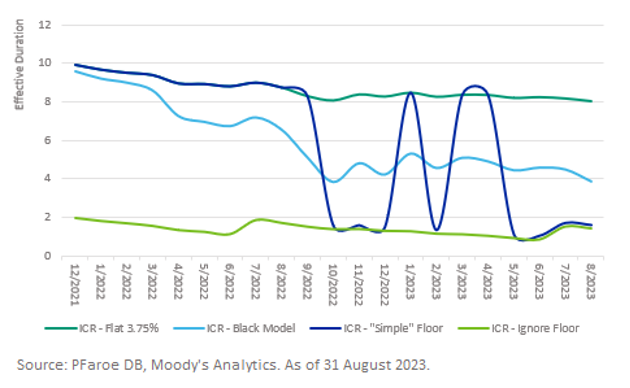
The following chart shows how the plan’s interest rate effective duration differs between these two approaches over the past 18 months. Two further comparators are included: 1) the ICR is assumed to be fixed at the floor rate of 3.75% (dark green) and 2) the ICR is assumed to be the 30-year Treasury yield ignoring the 3.75% floor (light green).
The dark blue line illustrates the oscillating pattern that can occur when the “simple” floor approach is used to determine the plan’s duration. During October 2022, the 30-year Treasury yield went from under to over 3.75% resulting in a sudden drop in the plan’s duration. In the past 12 months the 30-year Treasury yield has continued to fluctuate above and below the floor value of 3.75% resulting in a very volatile duration profile.
In contrast to the volatile duration profile produced by the “simple” floor approach, the light blue line utilizing Black’s model captures both the fixed and variable components of the ICR and produces a far smoother duration profile over time.
Pension Plan Analysis
If the floor is erroneously assumed to always apply (green line), the plan’s interest rate duration looks similar to a traditional plan with non-interest rate sensitive cashflows discounted at a variable corporate bond yield. This would lead to an LDI matching portfolio consisting primarily of high-quality credit securities. Since October 2022, such a portfolio would have significantly underperformed the liabilities leading to a significant drop in funding level.
If instead the floor is addressed using the “simple” approach, the interest rate duration can follow a very volatile pattern as seen over the past 12 months. This volatility would lead to a plan’s LDI asset allocation needing to shift quickly between a high-quality credit-based portfolio to a portfolio that includes a combination of both credit-based assets and a significant short position in Treasury bonds. Alternatively, the new portfolio could be constructed utilizing FRNs and/or CDS to maintain the credit spread risk exposure while achieving a low interest rate risk exposure. The negative consequence of this approach is the significant transaction costs that will be required to make sweeping changes to the underlying asset allocation over a short period of time. These transaction costs will then drag down asset performance leading to a likely drop in funding level.
Following the Black model approach to modelling the ICR leads to the most effective outcome from the perspective of constructing and rebalancing an LDI portfolio. In this case, the portfolio would likely always contain allocations to all of the asset classes already discussed. The problem then becomes one of regular monitoring and rebalancing. Transaction costs will be lower in this scenario leading to the best outcomes from a funding level perspective.
In conclusion
Cash balance plans that have a variable ICR with a minimum floor present a more complex risk management problem than may be immediately obvious. Simply taking the current Treasury yield and projecting it into the future presents a simplistic view of interest rate risk (the liabilities are then either viewed as entirely fixed or entirely based on future yields). Plans taking this approach have seen their liability interest rate duration fall by 80% as interest rates rose over the past 18 months leading to dramatic shifts needing to be made to any LDI strategy in place for such a plan. More sophisticated ways to model the liability interest rate sensitivity exist and can be modeled and monitored on a monthly or even daily basis helping practitioners to create and maintain more appropriate and resilient investment strategies where liability matching is a focus.
References
[1] October Three: Cash Balance Plans [Online]. Available: https://www.octoberthree.com/articles/cash-balance-plans-2018-survey-and-trends
[2] Fact Sheet: Cash Balance Pension Plans, U.S. Department of Labor [Online]. Available: https://www.dol.gov/agencies/ebsa/about-ebsa/our-activities/resource-center/fact-sheets/cash-balance-pension-plans
[3] Daily Treasury Par Curves, U.S. Department of Treasury [Online] Available: https://home.treasury.gov/resource-center/data-chart-center/interest